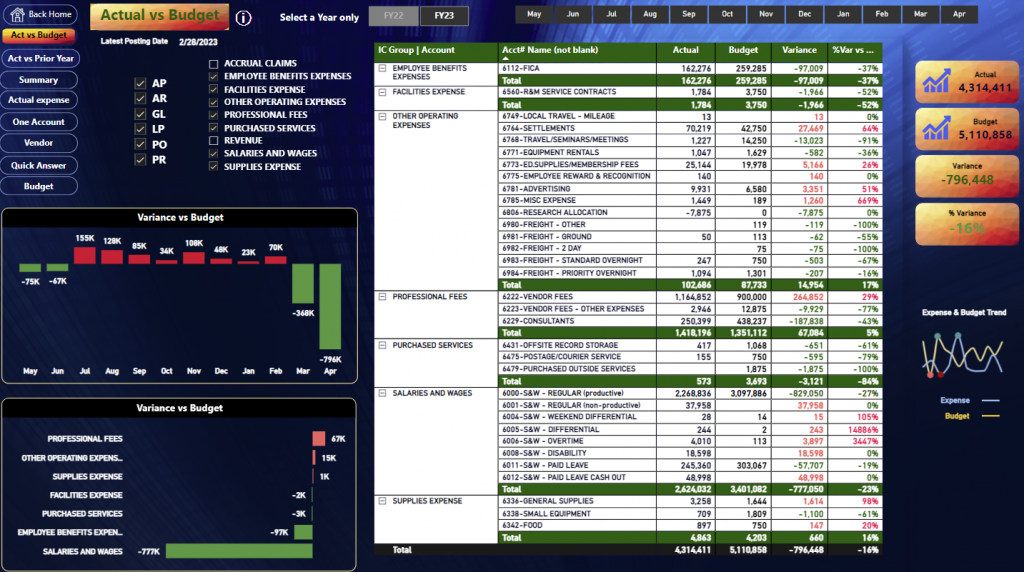
Shows the expenses for every account for the Fiscal/Calendar year, it reads from the General ledger Database.
–
 |
 |
 |
 |
|
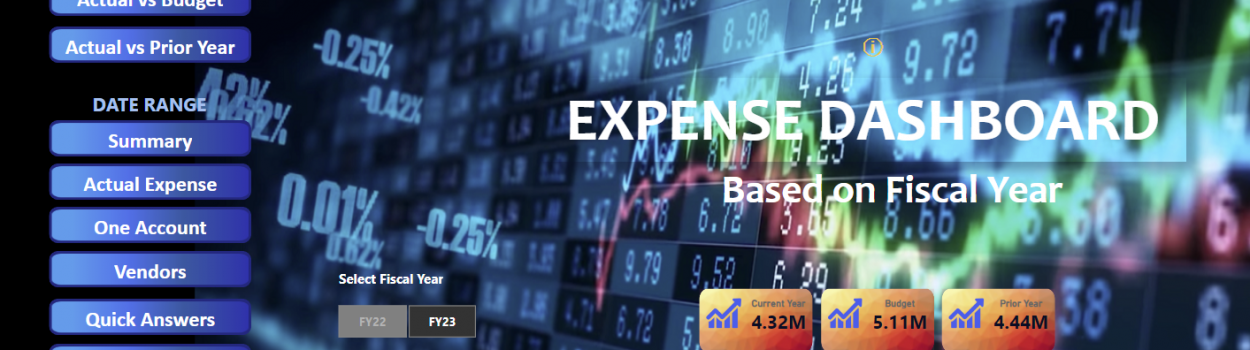
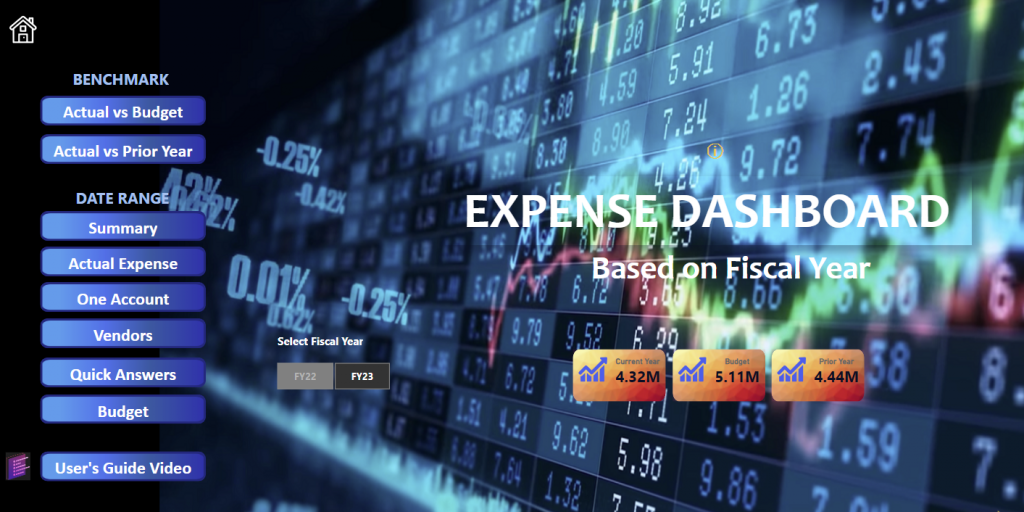
The dashboard provides finance teams a comprehensive and interactive view of their KPIs in the overview tab the CFO or finance director can view the expenses KPI’s with performance versus prior year using the slicers the user can select a versus budget comparison a date range such as quarter to date or specific Cost Center
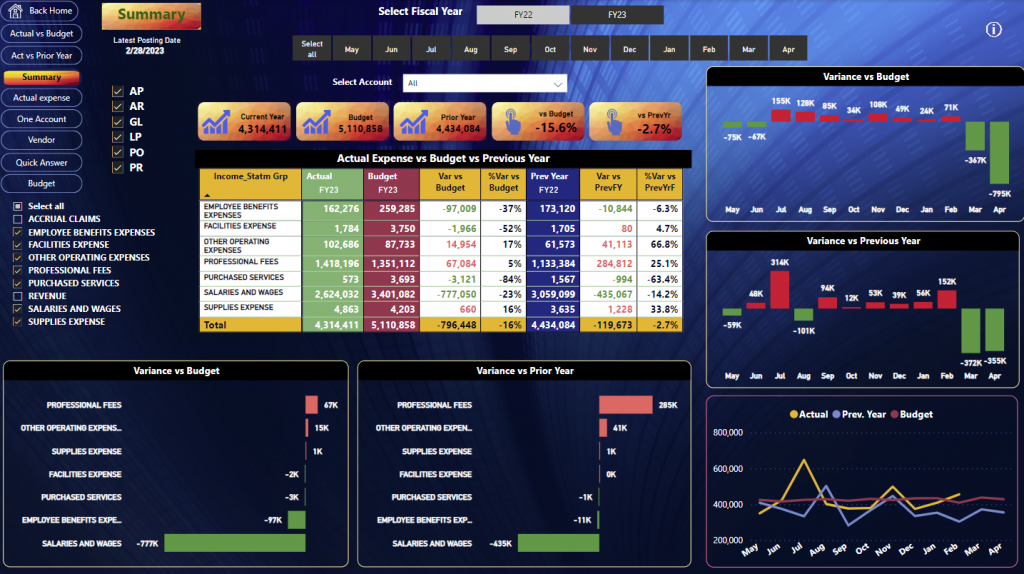
The user immediately spot how different accounts are affecting your bottom line and versus budget or versus prior year you can interact with your dashboard by selecting a specific Cost Center and drilling down into the specific accounts within your expense you can analyze which costs are accountable for general and admin expenses being over budget by ranking the table you can immediately identify which accounts are inflating general and admin expenses relative to budget.
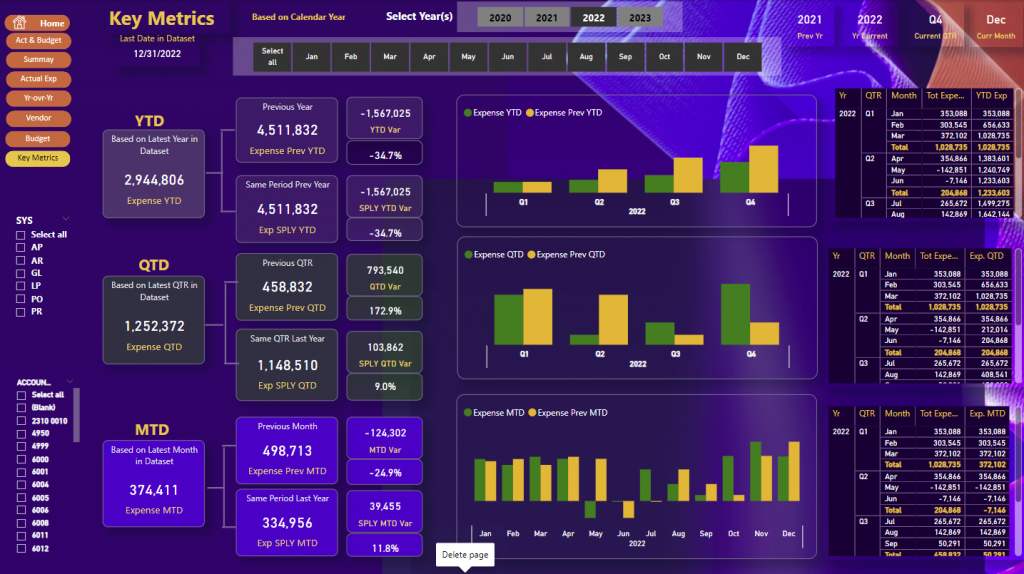
You can also view the full detail with actual amounts absolute difference in percentage difference relative to prior year or versus budget using the time intelligence of your choice and can be ranked by any of these KPI’s, You can see trends how have evolved over time; finally you can view and interact with your fully detailed expense table with actual absolute difference and percentage difference to prior or budget. Our Dashboard is designed to give finance teams an insight of the whole business and overview of their most crucial KPI’s and a drill down into the underlying accounts and their performance
-ACTUAL, BUDGET AND PREVIOUS YEAR COMPARISON: -Year-Over-Year -Vendor -Budget -QTD -MTD |
–